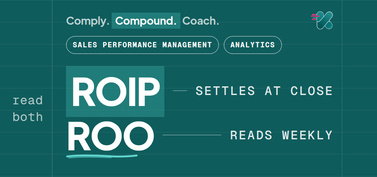
Incentive effectiveness has two readings, ROIP and ROO.
What the incentive line already costs you
Marketing budgets run at 7.8% of company revenue on Gartner's 2026 survey of 401 marketing leaders. The cost of selling runs at 7.9% of revenue on the Alexander Group's cross-industry B2B benchmark. Two lines of a similar size sit in the same profit and loss account.
The marketing line is read weekly, by channel, by campaign and by cost per acquisition. The incentive line is read after the period closes, as a total. That total is accurate. It records the amount that left the business and the payee it left for.
It records nothing about what the field did to earn it. Which outlets opened. Which products moved. Which reps started earning for the first time. Which of them could state the gap to their next slab on a Tuesday afternoon.
Provenance: 7.8% · Gartner 2026 CMO Spend Survey · 401 marketing leaders · 7.9% · Alexander Group · cross-industry B2B compensation cost of sales benchmark
A payout total tells you the amount. It does not tell you the return, and it does not tell you the behavior.
Why a payout total stops being an answer
Three things are missing from it, and each one has a different fix.
The missing counterfactual
A payout total has no comparison in it. Sales rose 12%, the scheme paid ₹50.00L, and nothing in either figure says whether the 12% needed the ₹50.00L. Incentive attribution modeling built on a before-and-after comparison inherits everything else that changed in the period: a price revision, two launches, a competitor withdrawal, a monsoon. That makes the scheme responsible for all of them.
The margin the payout comes out of
Incentives are paid out of margin. A scheme read on revenue looks identical whether the field sold the flagship line or the line the business makes almost nothing on. Blended gross margin across the portfolio hides the same thing more politely. The number that matters is the contribution margin on the incremental units the scheme actually moved.
The lag between the behavior and the number
A payout total arrives after the period it describes. By then the field has already decided which outlets to call on, which products to lead with and which slab to chase. A plan owner reading that total learns whether the quarter worked. A regional manager learns nothing they can act on.
Two of these are fixed by how the number is built. The third is fixed by reading a different number.
ROIP, and what it takes to calculate one
ROIP is return on incentives paid. It states what a scheme returned on the money it cost, against a comparison group who were not on it.
ROIP = (incremental margin minus incentives paid) ÷ incentives paid
Worked through on illustrative figures, for one scheme and one closed quarter. Incentives paid, ₹50.00L. Payees on the scheme sold ₹20.00Cr. A matched group of peers sold ₹15.00Cr. Incremental sales are ₹5.00Cr. Contribution margin on those sales, at 30%, is ₹1.50Cr. Net of the ₹50.00L paid, ROIP is 200%.
Provenance: illustrative figures, shown to demonstrate the calculation. Not a Kennect deployment reading.
The denominator is the whole cost of the scheme
Incentives paid is not the payout run. It is the payouts, plus the accruals still open for the period, less the clawbacks recovered against it, plus the rebates settled on the same sales. A clawback that lands two cycles later belongs to the cycle that earned it. A plan that cannot recalculate a closed period cannot hold a stable denominator. Recalculating a closed period is a function of the ELT and Calculation Engine rather than of the report built on top of it.
Sales commission capitalized as a cost of obtaining a contract under ASC 606 and IFRS 15 creates a second number. Finance holds the amortized charge. Sales operations holds the cash paid. Settle which one the ROIP uses before the first reading, and hold it every quarter after.
The numerator is margin, and only on the incremental units
Take the contribution margin on the difference between the two groups, not on the total the scheme's payees sold. The scheme is not responsible for the sales that would have happened anyway, and it does not get credited with the margin on them.
The matched group is the method
Match on the things that move sales without any help from the scheme. Role, market, period, product mix, quota and tenure. Then check what you have not matched on.
Do not match on attainment. Attainment is the outcome under test, and a group matched on it reads high every time. Do not match on engagement either, because engagement is the behavior the scheme exists to change. Matching on either one guarantees a flattering answer and will not survive the second question in a finance review.
When there is no unexposed group
A national scheme covering every payee has no control group, and that is the ordinary case. Two substitutes work. Both are weaker than a matched group, and saying so is part of the reading.
A staggered rollout gives you one. Hold one zone a cycle behind and treat it as the control. The slab boundary gives you another. Compare payees who finished a little above a threshold against payees who finished just below it, where the plan treated two near-identical groups differently for reasons neither controlled.
What the number decides
ROIP does not answer whether to run incentives. It answers where the next rupee of the incentive budget goes, which is the question incentive compensation management [link: /incentive-compensation-management] is built to settle scheme by scheme. Read at plan level it is a governance number. Read by scheme, zone, channel and slab it is a design number, and that is the level where it changes anything.
It also needs a settled period. Clawbacks applied, adjustments booked, the plan version frozen. A plan with four periodicities reaches 19 closes a year, and each close applies the same six mechanics, which is 114 mechanic applications against one dataset. One close, one ROIP.
Provenance: 19 closes and 114 mechanic applications · anonymized mid-sized Indian pharma, top 50 by market share, 1,000 or more medical representatives
ROIP is a settled number. It tells a plan owner what they bought last quarter, and it tells them after last quarter has gone.
ROO, and the objectives worth setting
ROO is return on objectives. It reads the plan against what the plan asked for; in the unit the objective was set in. A plan that asked for 50 new outlets and got 60 reads 120%. No rupee figure is involved, which is why the reading is available before the money is.
Variable pay used this way is an instrument. It is not settling an obligation; it is directing behavior, and an instrument is judged by whether the behavior moved.
Five families of objective cover what an Indian field plan is usually trying to buy.
| Objective family |
What the plan is asking for |
How it reads |
Cadence |
| Coverage |
Outlets opened, doctors called, beat adherence, stockists billed |
Achieved against planned |
Weekly |
| Mix |
Sales from the priority products the scheme pays on |
Priority share of total |
Weekly |
| Earning base |
Payees earning anything at all by month two |
Earners as a share of payees |
Monthly |
| Quality |
The qualifiers that gate the payout: call average, coverage, listed-doctor compliance |
Passed against attempted |
Weekly |
| Habit |
Days a payee is active, gap to the next slab checked, plan understood |
Active days, checks, comprehension |
Weekly |
Two rules keep an ROO honest. The objective is written down before the period starts, with its number against it, because an objective set afterwards is a description of what happened. And the objective has to be something the field can move inside the period. An objective a rep cannot change by Friday is a target, and a target already has a payout attached to it.
ROO is the reading available while the period is still open, because it is denominated in the objective rather than in rupees.
Habit is the objective that predicts the other four
Four of the five families describe something a rep produces. Habit describes whether the rep is in the plan at all.
A plan can calculate correctly, pay on time, and still be a plan the field is not running against. The test: stop a rep in a corridor and ask what they earn if they close one more order this week. A rep who answers in rupees is inside the plan. A rep who cannot is being paid by it and not steered by it.
That is why habit sits upstream of coverage, mix and quality. A rep who cannot state the gap cannot choose between two calls on a Tuesday. Every coverage and mix objective is decided by that choice, forty times a week. Habit also has the shortest feedback loop in the set. Days active exists on Monday morning, where a coverage number needs the week to finish.
Habit objectives are the ground the sales habit formation argument stands on, and they are worked rather than watched. The instrument is a nudge. It is a timed, calculated prompt naming the gap in rupees, sent to the payee on a day they can still act on it. Kennect delivers these through AI-Powered Nudges, computed against the calculation the payout runs on, so the number in the prompt is the number in the cockpit.
Habit is the objective that decides whether the other four are being run against at all.
What one deployment shows
Across one anonymized deployment, payees who used the app gained 4.2% in attainment over the period. Payees in the same cohort who stayed off it gained 2.0%. That is roughly twice the movement, on the same plan, in the same period.
Inside the same cohort, payees active 25 or more days a month sat at 125.4% attainment against 106.8% for the cohort as a whole, which is 17.4% higher. Over the same window the share of the field earning anything at all widened from 34% to 76%, across roughly 8,000 payees. The base of earners widened. The size of each earning did not.
Provenance: engaged against not engaged, and daily-habit lift · same anonymized Kennect deployment, roughly 8,000 payees, same role and same plan · share of field earning, 34% to 76%, same cohort
What these readings do not show matters more than what they show. They are correlations and not controlled trials. A payee who opens the app more is plausibly a payee who was already going to sell more, and nothing here separates the two. The groups were not matched on role, market and product mix before the period began, which is the exact step the previous section said the method depends on.
So these are published as ROO readings. They describe behavior against objectives, at a cadence someone could act on. They are not a ROIP figure and are not presented as one.
Kennect publishes no ROIP figure of its own. Return on incentive spend across the deployments we run has not been measured to a standard a finance team would accept. When it is measured to this method, it will be published with its cohort, its period and its stated limit.
These readings are strong enough to set an objective against. They are not strong enough to call a return.
Where this leaves you
Two readings, two cadences, one record underneath both. ROIP needs the payee, the source sale and the matched group held together, which is the same lineage the audit pack finance exports is built from. ROO needs the objective written down before the period and the behavior read against it weekly.
Start with what the data already allows. Pick one scheme and one closed period, build the matched group, run ROIP once, and state its limit in the same paragraph as the figure. Then set one habit objective for the period you are in and read it on Mondays.
ROIP tells the plan owner whether the scheme worked. ROO tells a regional manager whether it is working. Compounding sales performance needs both readings, and both need the same record underneath them.
Read how incentive plan ROI is measured











.png)