Planners test slab, scheme and target changes against live data, see cost and revenue impact side by side, and track the return on incentives paid once the plan goes live.

*India pharma share based on a field force of 600,000, as reported by Hindustan Times.
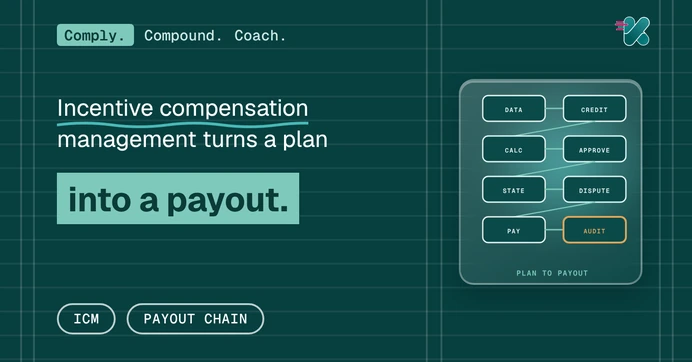
Kennect transforms the way you handle incentives, offering a seamless, automated solution that streamlines your process end-to-end.
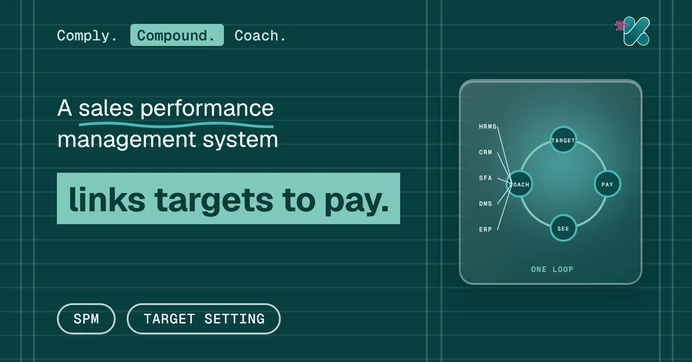
Our platform becomes the single source of truth for all your sales performance-related data. Use it for performance evaluation, employee appraisals, and business strategy discussions.
Bridge the gap between having data and using it. Analyze performance metrics, identify trends, and adjust incentive structures to align with organizational goals.
Leverage ‘What-If’ analysis to ensure that Incentive plans remain responsive to dynamic business environments.
Optimize resource allocation, ensuring that incentives are distributed effectively without unnecessary overhead costs.

Stay agile with Kennect’s intuitive platform. Quickly modify compensation plans to align with your evolving business needs, ensuring your strategies are always current and competitive.
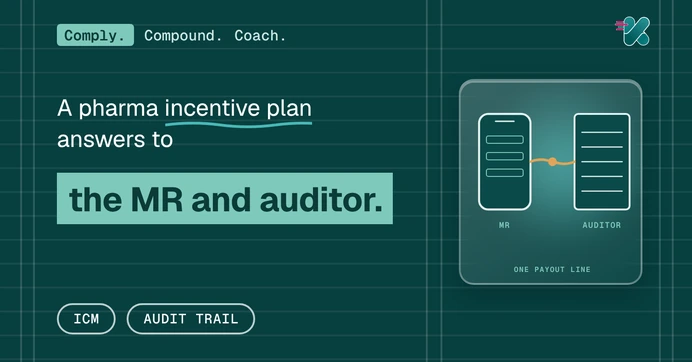
Mitigate risks associated with non-compliance and potential legal issues using our ready to use reports in standard audit formats.
Secure sales processes and maintain compliance with global and region-specific regulatory, financial, and security standards.
Ensure sales and commission processes are compliant with ASC 606 and other policies

Compare the scheme against a baseline, not against last year: the incremental revenue above the trend for the payees on the scheme, divided by the incentive cost of producing it. Incentive plan ROI measurement only holds when the baseline and the payout are calculated from the same data. Kennect runs that comparison on the payout data itself. The method is set out in how incentives move revenue.
Watch three numbers while the quarter is open: how attainment is distributed across payees, how many reps sit just below the next slab, and incentive cost per unit of incremental sales. Incentive effectiveness measurement reads these weekly so a weak scheme is corrected before it closes. Leadership sees them in one view, described for sales leadership.
Yes: cost the scheme against expected lift before it goes live, then check the actual lift after the first cycle. A sales incentive ROI calculator needs three inputs, the baseline sales, the expected lift and the payout curve. Model the lift side with the free sales lift calculator, then run the full scheme on your own data inside Kennect.
It means each cycle's results feed the next plan: schemes that lifted revenue are kept and tuned, schemes that only paid for growth that was coming anyway are retired. Compounding sales performance comes from changing the plan on evidence each quarter rather than once a year. Targets are reset on the same data, as with the sales target calculator.
Show three lines: incentive cost as a share of incremental revenue, the change in attainment distribution since the plan changed, and the cost of disputes and corrections removed. A board reads payback, not payout totals. Kennect clients automate ₹1,200 Cr+ in incentives a year, and the analysis runs on that same payout data. See how leaders compare schemes in AI performance insights.
Yes: run the new design on a matched cohort for one cycle while the rest stay on the current plan, then compare attainment and cost per unit of lift. Incentive effectiveness measurement on a cohort removes most of the guesswork from a rollout. Scheme changes are versioned, so mid-period changes stay auditable, as explained in changing a plan mid-year.
How enterprises moved incentives off spreadsheets, and what changed after go-live.